
The Real Feel

Modern survey platform with real-time public opinion

RESEARCH, UX DESIGN, DEVELOPMENT
Platform

Web

Industry

Tech, AI

Overview

The Real Feel is a new crowdsourced survey app that allows people to respond to simple quizzes to get a pulse on their local community, covering topics such as local transit, election opinions, sports team performance, and more. By offering a fun and engaging polling platform utilizing AI, The Real Feel aims to understand community sentiments and enhance daily lives.

Perpetual worked closely with The Real Feel to design the initial prototype and user experience for the application. As a returning client, the founder of The Real Feel relied on our expertise to bring their vision to life. Following the successful design phase, The Real Feel is now working with Perpetual to take the designs into development.

Three smartphone screens showing The Real Feel app interface: left screen displays user responses including preference for cats and mood entries; center screen shows a map with icons representing data points and a question about preferring cats or dogs with a progress bar; right screen lists available data reports with options to purchase or answer questions for access.
Outcome

Our collaboration with The Real Feel has resulted in a well-crafted and user-centric platform, poised to transform how communities share and understand their sentiments. We’ve set the stage for The Real Feel to become a leading platform in the polling and sentiment analysis space. We created a cohesive and engaging user journey. The Real Feel is now positioned to provide valuable insights and foster a deeper understanding of community feelings, helping organizations and individuals make more informed decisions.

Approach

‍The Perpetual team collaborated with The Real Feel through a multi-faceted approach. Our team conducted UX research, competitive analysis, and user persona development to create a robust foundation for the app.

We designed a user-friendly interface that captures and summarizes daily sentiments anonymously, providing visually real-time data with hyperlocal and demographic information.

By integrating with advanced data analytics and visualization tools, we ensured that the platform was not only engaging but also highly informative for users.

Daily Questions
Collecting data in an attention-grabbing format

We designed a feature where users are posed 1-3 questions daily. Some questions include a sliding scale for overall mood, emotion selection, and space for notes explaining their responses. Others are simple yes, no, or "I don't know" responses. By encouraging users to come back to The Real Feel daily, this feature enables the efficient and engaging collection of polling information.

Poll question 3 of 3 asking, Do you prefer cats or dogs? with four answer choices: Cats, Dogs (highlighted), Neither, and Both, each with corresponding icons. Below is an optional text box with the user response, 'Dogs are more friendly and loyal to their owners!' and a green Submit button.
Digital survey question labeled 'Question 1/3 How are you feeling today?' with a rating slider set to 5 and mood options including Ok, Bored, Tired, and Other, plus an optional text box to explain why in 15 words or less and a checkbox to keep the reason private.
Survey question 2 of 3 asking if you have ever joined an online-only community with three response options: a red thumbs-down labeled No, a green thumbs-up labeled Yes, and a question mark labeled I don't know, plus an optional text box prompting to explain why in 100 characters or less.
Detailed mapping
Designing a community-based platform

The platform includes a detailed map that shows the breakdown of answers from a hyperlocal view. With The Real Feel heatmap, we can see how communities are feeling at a larger look. This visual representation helps users easily understand the distribution of sentiments and opinions across different regions and demographics, making the data more accessible and insightful.
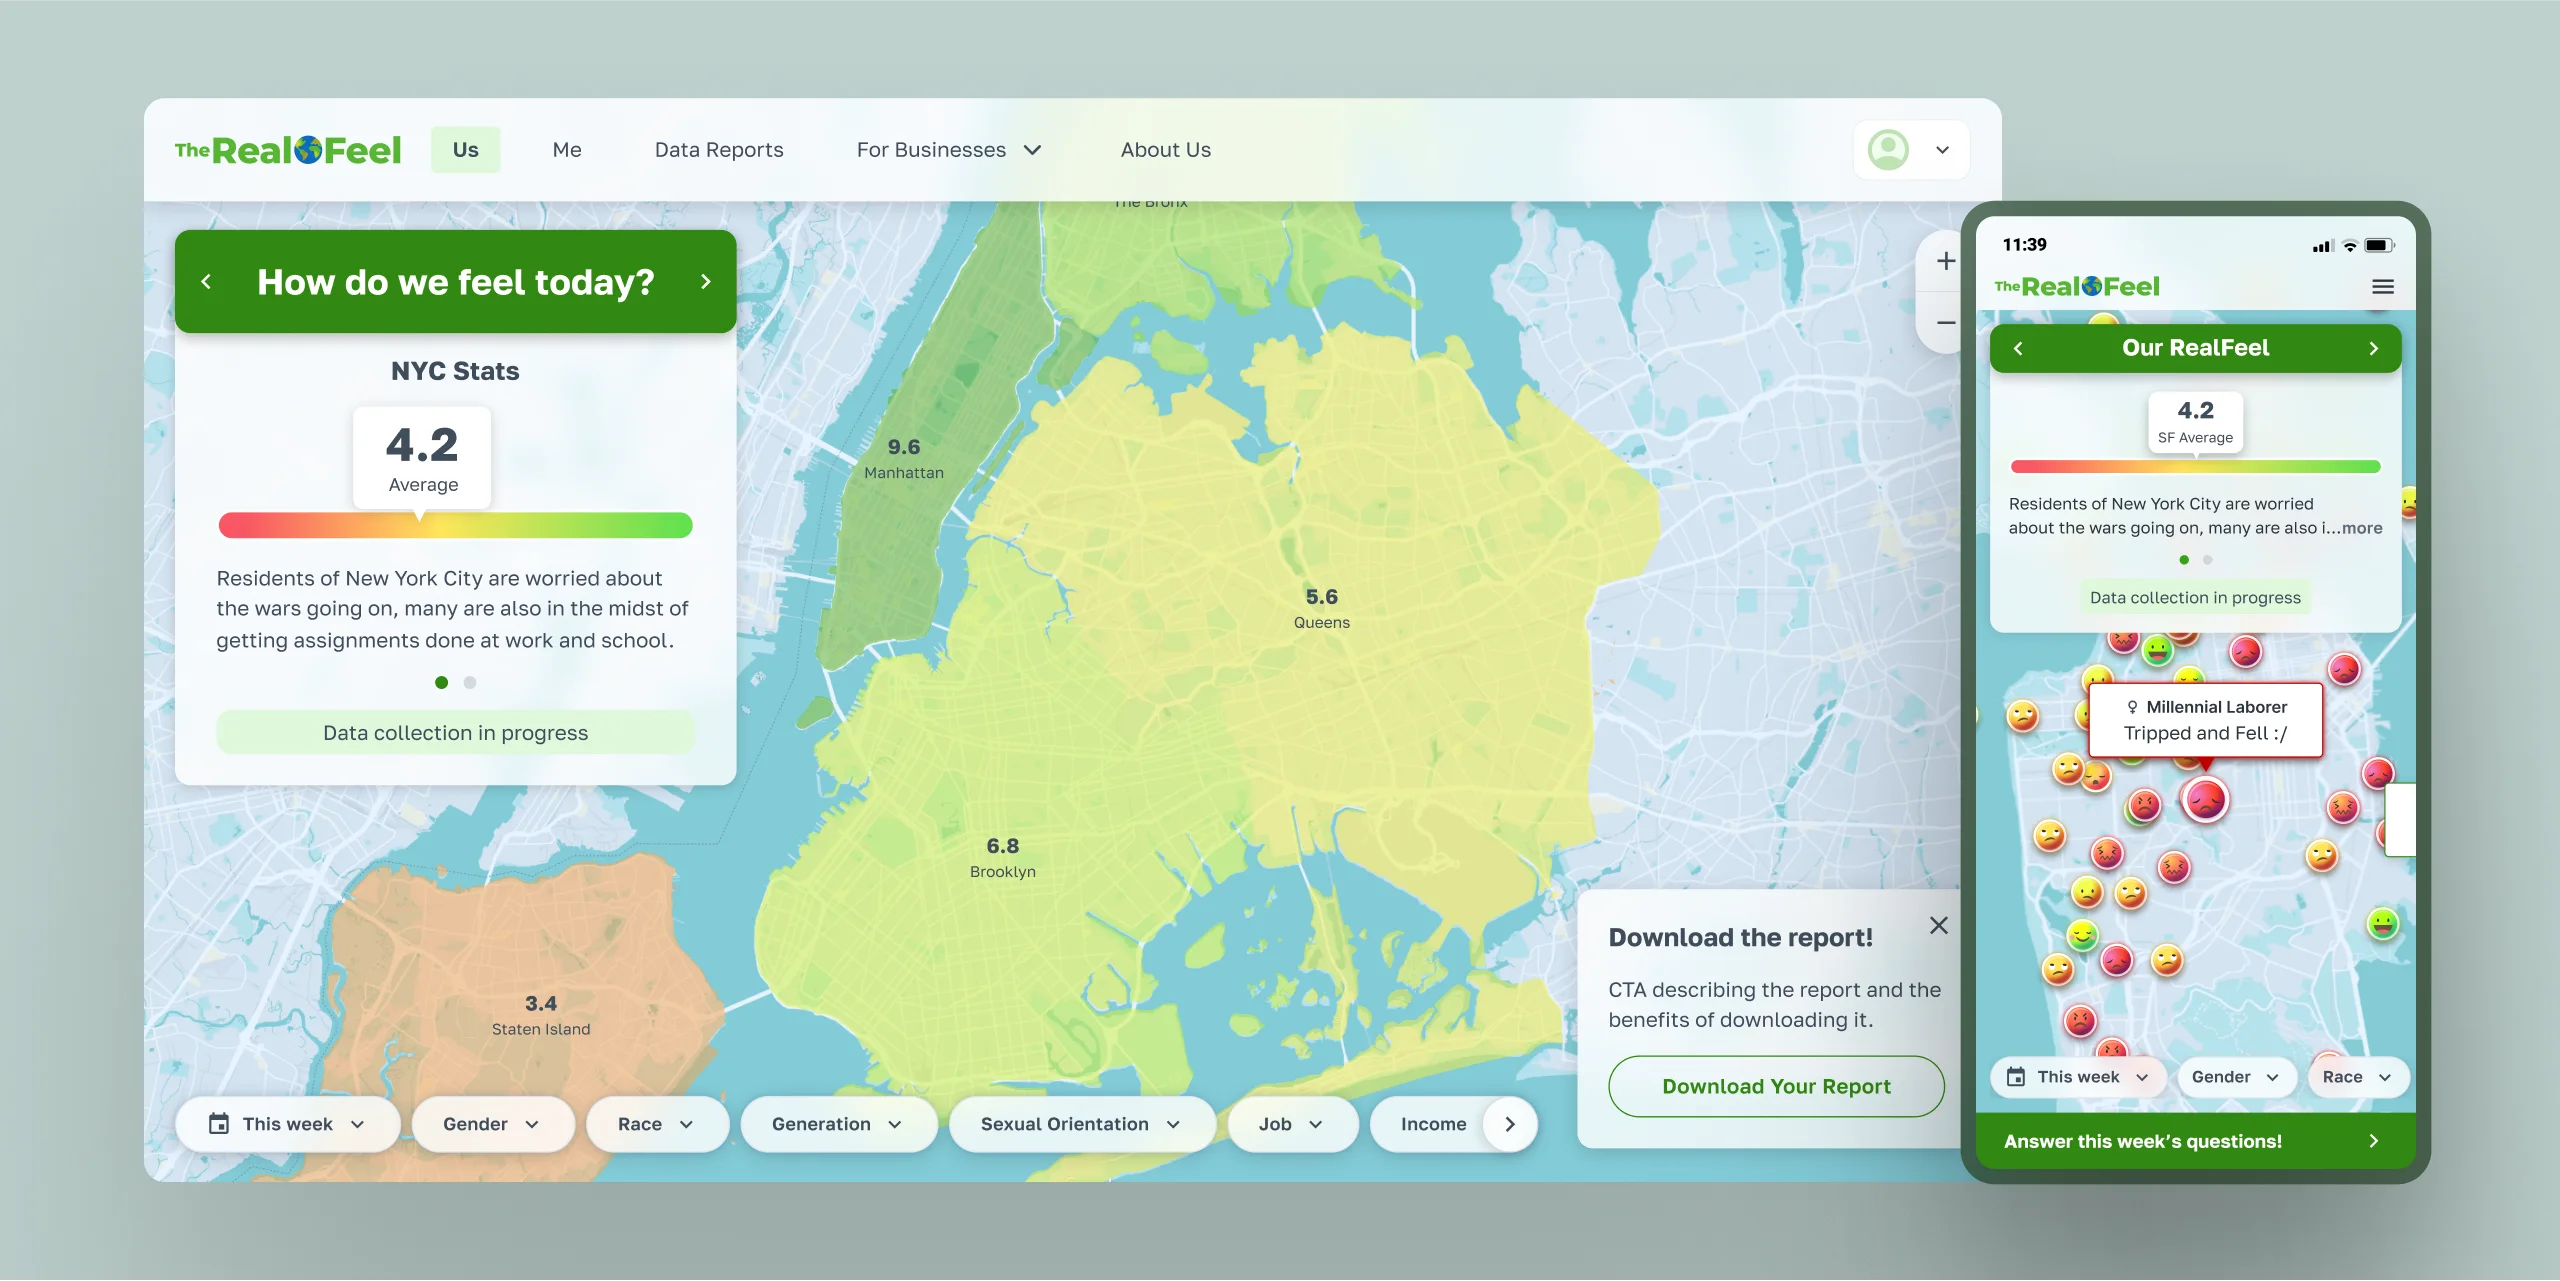
Screenshot of The RealFeel website showing a map of New York City boroughs with color-coded average feelings ratings: Manhattan 9.6, Brooklyn 6.8, Queens 5.6, Staten Island 3.4. A pop-up highlights NYC Stats with an average rating of 4.2, indicating residents worried about wars while managing work and school, with data collection in progress. The interface includes filters like week, gender, race, generation, sexual orientation, job, and income. A mobile view shows a real-time map with emoji markers and a comment from a user labelled Millennial Laborer saying 'Tripped and Fell :/'. A prompt encourages downloading a report and answering weekly questions.
Data reports & Content Examples
Creating assets to help The Real Feel grow
From the gathered responses, we generate comprehensive data reports and social media content. These reports offer valuable insights to B2B clients, such as marketing agencies, brands, government institutions, educational institutions, data brokers, media publishers, and news sites.
The reports help clients understand community sentiments and make informed decisions based on the data. Based on the questions answered, we also have created templates that allow for The Real Feel team to create exciting and relevant social media content.
A report titled 'Overall Summary' featuring bar charts labeled 'Emotion Response Breakdown' and 'Numerical Response Breakdown' with percentages and corresponding emoticons from green happy to red angry. Sections summarize positive, happy, calm, and excited responses. A demographic section shows mood by gender with a progress bar and text about women’s concerns. Overlaying this is a popup titled 'Two easy ways to get access to this report' with options to answer today’s question or purchase the report, each accompanied by icons and arrows.
Impact
From 0 to 1 to market traction

The collaboration between Perpetual and The Real Feel has resulted in real-time, engaging polling platform live in the market.

The Real Feel is a first-of-its kind modern B2B polling platform and a consumer social intelligence tool.

It provides accurate and comprehensive insights into community sentiments, helping organizations make better-informed decisions, with several enterprise customers already signed up.

Bring your vision to life.